 Brolly
 Your Dashboard at a glance
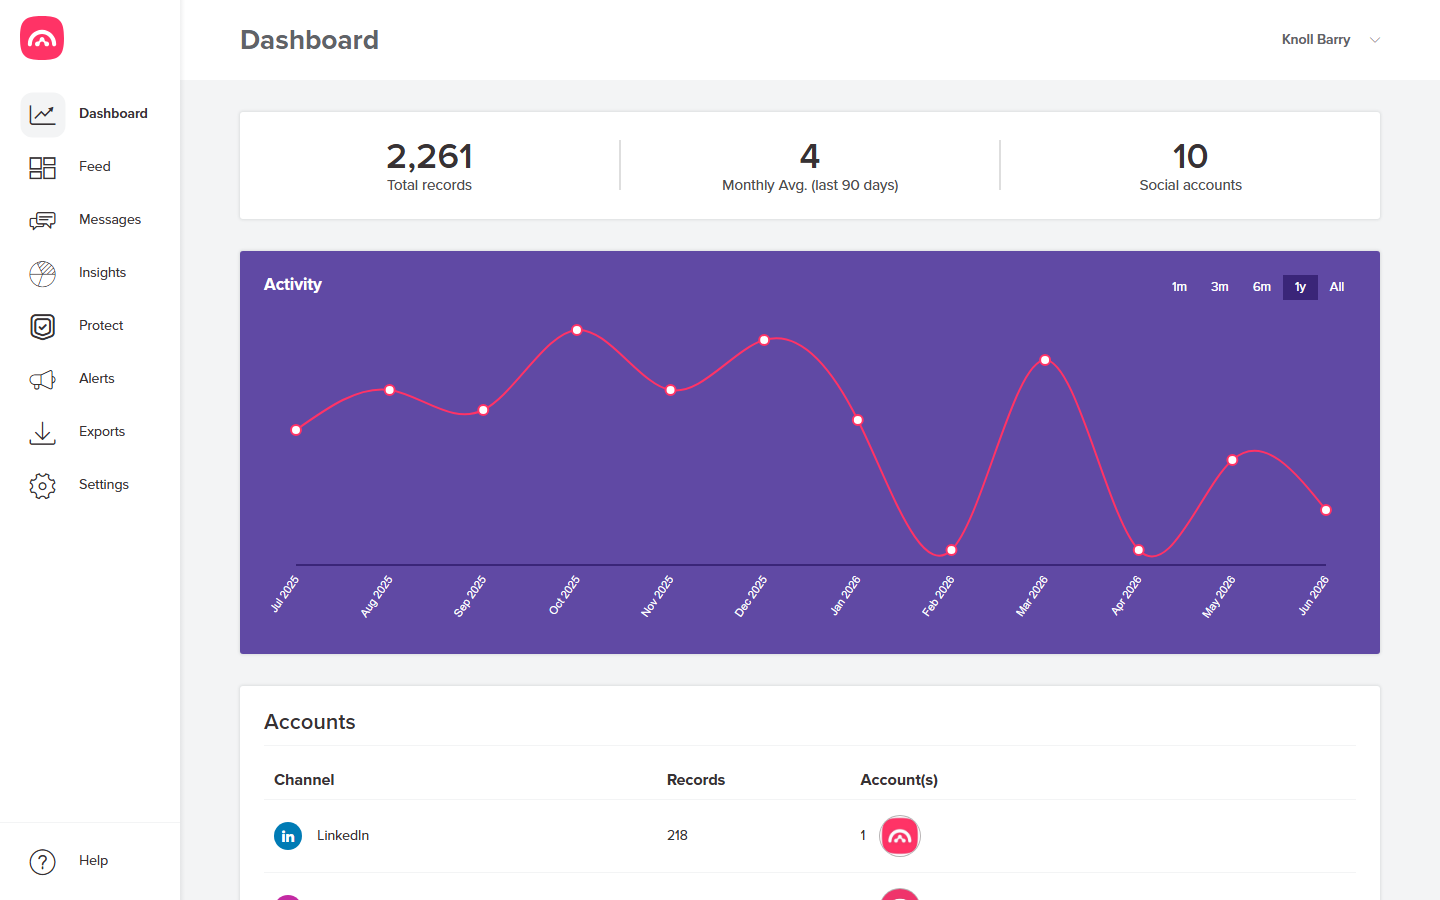
The Dashboard shows your capture totals, activity over time, and every connected account's record count.
The Dashboard is the first screen you see when you sign in — a live summary of what Brolly is capturing for your organisation.
What it shows
- Total records — everything Brolly has captured across all your connected accounts.
- Monthly average — your capture rate over the last 90 days.
- Social accounts — how many accounts are connected.
- Activity chart — records captured over time; switch between 1m, 3m, 6m, 1y and All.
- Accounts table — each channel with its record count, so you can spot an account that's gone quiet.
Reading the activity chart
Spikes usually line up with busy periods — campaigns, consultations, emergencies. A connected account that flatlines unexpectedly is worth checking under Settings → Accounts: if its status shows On hold, the connection needs a reconnect.
Where to next
Was this article helpful?