Exporting an Insights Report
Choose the sections you want, confirm the period and sources, and get the whole Insights section as one PDF report.
Overview
The Insights report is a printable version of the Insights section — Performance, Publishing, Platform comparison, Publishing actions, Engagement, Sentiment, Topics and Hashtags — for the date range and sources currently set. You pick which sections to include in a dialog, and the report is prepared as a PDF to share with people who do not use Brolly.
How to Get There
- On Performance, Publishing, Engagement, Sentiment or Hashtags, set the date range and sources you want the report to cover (Topics has no toolbar of its own — set the scope on another page first if you will open Export from Topics)
- Click Export at the top right
The Export Dialog
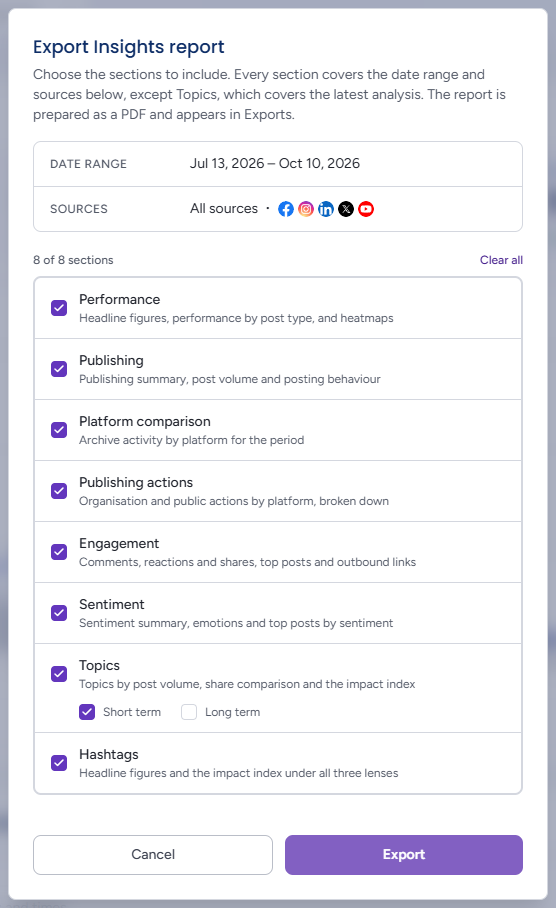
Export Insights report opens over the page. It is the same dialog on every page, offering every section and starting with all of them ticked, so the default output is the same wherever you launch it from.
-
At the top, a box states the Date range and Sources the report will cover, with an icon for each platform in scope. These are the page's own settings — or, on Topics, which has no toolbar of its own, the last range and sources you chose on another Insights page. If Threads is among the sources, a line says Threads isn't included in the report yet
-
Beneath, a counter reads 8 of 8 sections with a Select all / Clear all link beside it, then the list of sections, each with a one-line description of what it holds: Performance, Publishing, Platform comparison, Publishing actions, Engagement, Sentiment, Topics and Hashtags. Click a row to tick or untick it; the list scrolls inside the dialog on a short window
-
While Topics is ticked, two boxes beneath it choose the analysis to print, Short term and Long term. The one the Topics page is showing starts ticked; you can tick both
-
A hint below the list says Select at least one section to export or Select at least one Topics term while the request would be empty, and Export stays greyed out until it is satisfied
Export requests the report and reads Exporting… until it is accepted, then the dialog closes; if the request is refused the hint turns red with The report couldn't be requested. Try again. Cancel, the ×, the Esc key or a click outside the dialog close it without exporting.
The Report
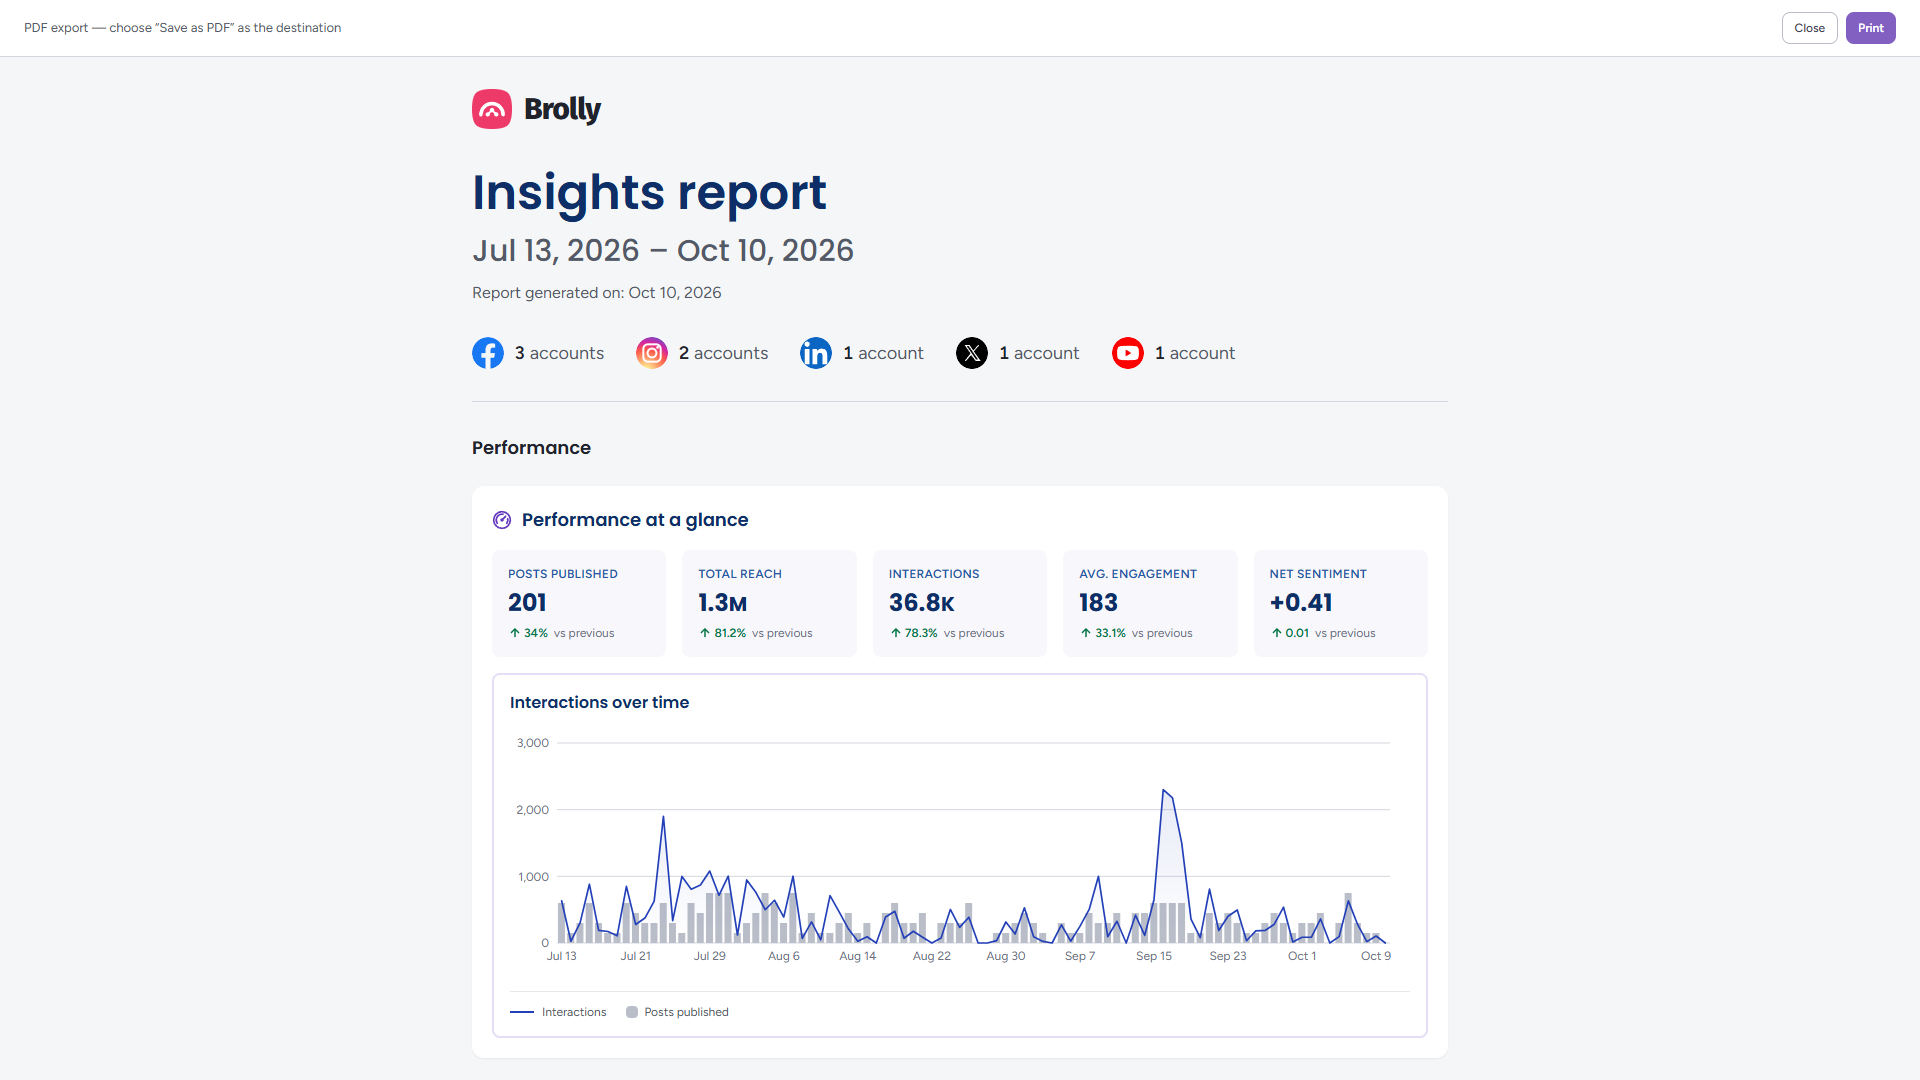
The report is prepared as a PDF away from the page and appears under Exports, where you download it like any other export — see Exports. Its pages are the Insights panels as they appear on screen, laid out for paper:
What the Report Contains
The report opens with a title page: the period, the day it was generated, and the platforms and accounts it covers, with one account count per platform. A report that leaves sections out lists the ones it has — Sections: Performance, Engagement — so a reader cannot mistake a dropped section for one that had no data.
Then come the sections you ticked, in the sidebar's order, each starting on a new page and all for the one scope:
- Performance — the headline figures, interactions over time, performance by post type, and the day-and-time grids for all three views, with the value written into each cell so they read in black and white
- Publishing — the publishing summary, volume and behaviour
- Platform comparison — always as the table
- Publishing actions — every platform opened onto its three parts
- Engagement — Comments, Reactions and Shares as three stacked lanes, the top posts by each of the four rankings, and outbound links. Post performance is not printed: it is a chart to hover, and on paper it is an unlabelled cloud
- Sentiment — the summary and sentiment over time, emotional response, Top positive posts and Top negative posts, and the sentiment distribution
- Topics — the latest analysis for the horizon or horizons you ticked, headed not limited to the report's date range or scope: the topics by post volume, both share comparisons and the impact index under all three lenses
- Hashtags — the headline figures and the impact index under all three lenses
The Posts Explorer table is not part of the report.
Tips
The report reflects the toolbar, not the page you were on: set Last 90 days and the accounts you want before clicking Export, and every section except Topics will cover that scope. Topics prints the organisation's latest short- or long-term analysis, which is not limited by the date range or sources, and the PDF labels it that way.
For a recurring monthly or quarterly report, note the date range you used so the next one lines up. For exports of the underlying records rather than the analytics, see Exports.