Publishing
How much you publish and when, the mix of post formats, your most recent posts, a platform-by-platform comparison of archive activity, and what your accounts and the public did in the period.
Overview
Publishing is about output rather than response: how many posts went out, on which days, in which formats, and how that compares with the previous period and across platforms. It also lists your most recent posts, holds the platform comparison table that used to sit on the old Overview page, and ends with Publishing Actions — a count of everything your accounts and the public did in the Archive during the period, including moderation.
How to Get There
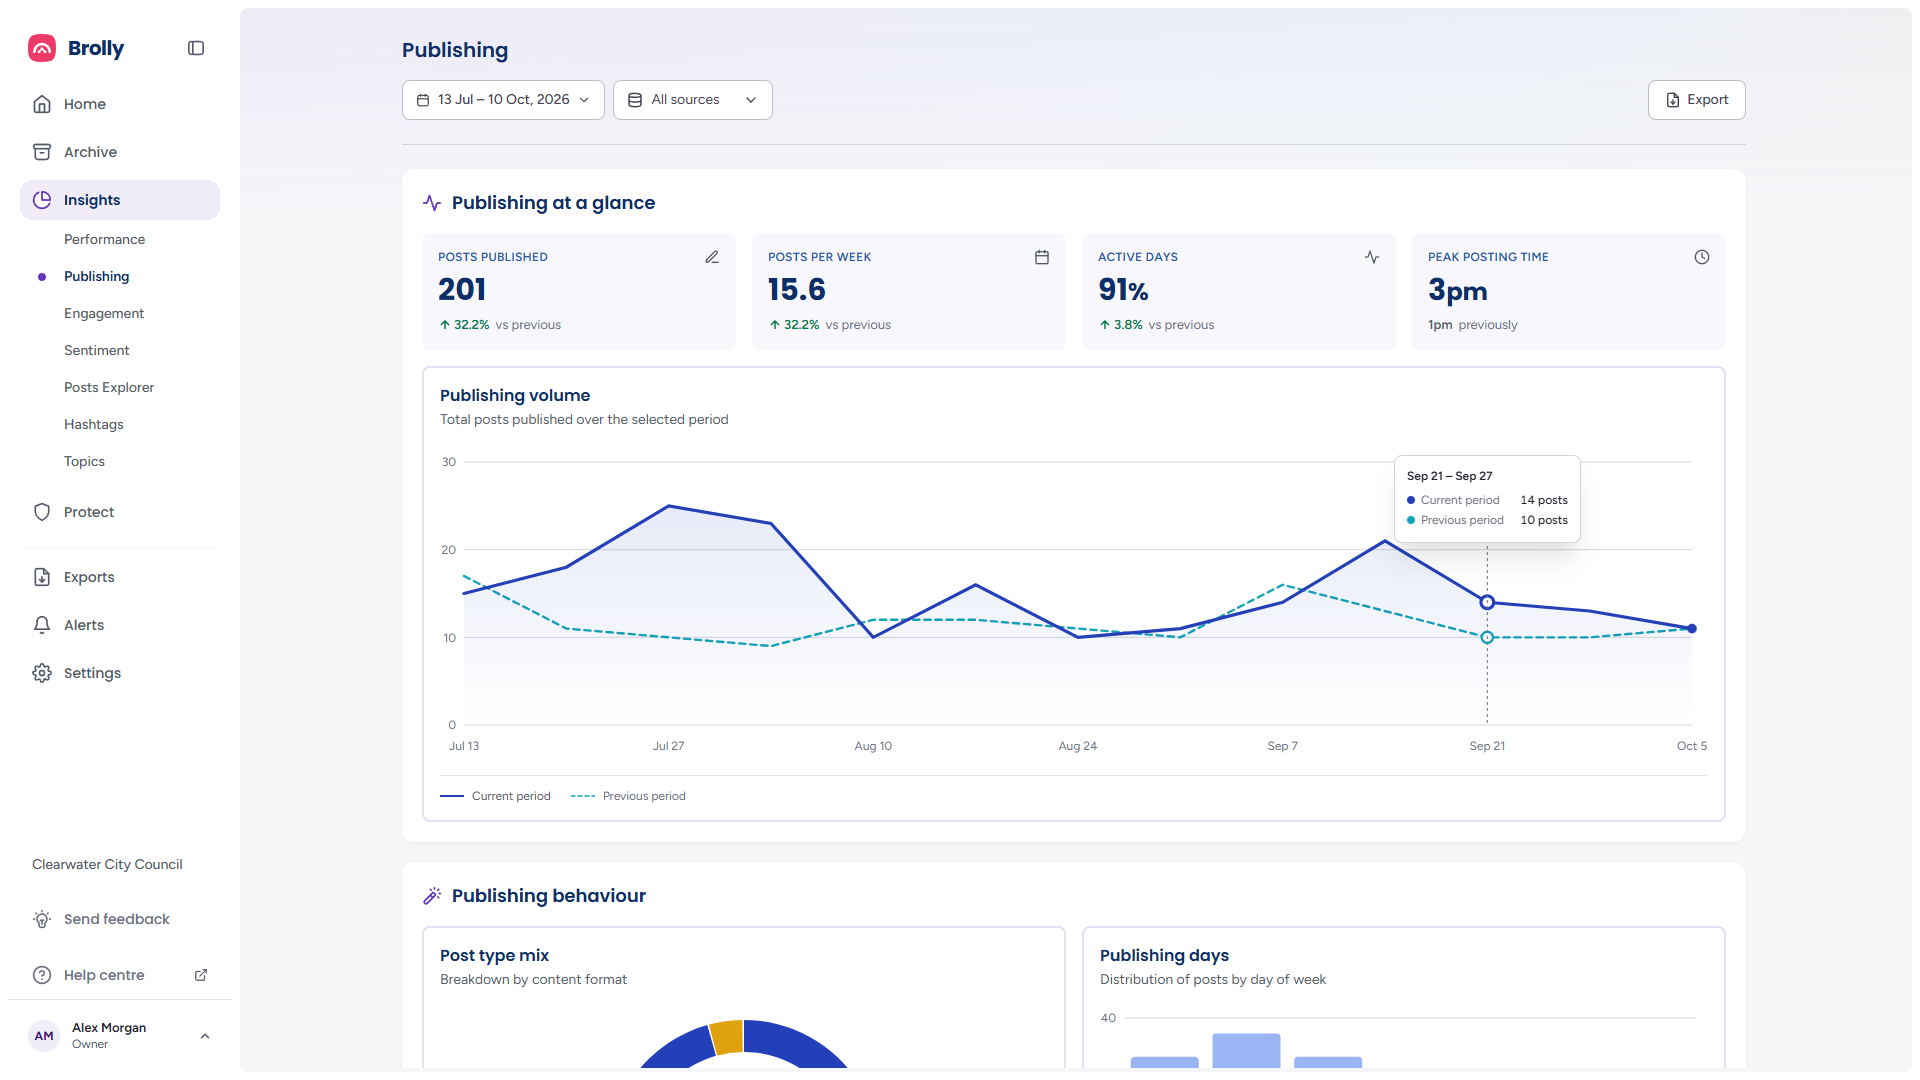
- Click Insights in the left sidebar, then Publishing
Set the period and accounts with the date range and sources controls at the top, and use Export for the printable report. They are described in The Toolbar.
When the period holds no posts, the page shows one message in place of the panels: No posts in the selected period. Try widening the date range or clearing scope filters. If no account is connected at all it says so instead and offers a Connect an account link. Most recent posts and the platform panels still draw beneath it.
Publishing at a Glance
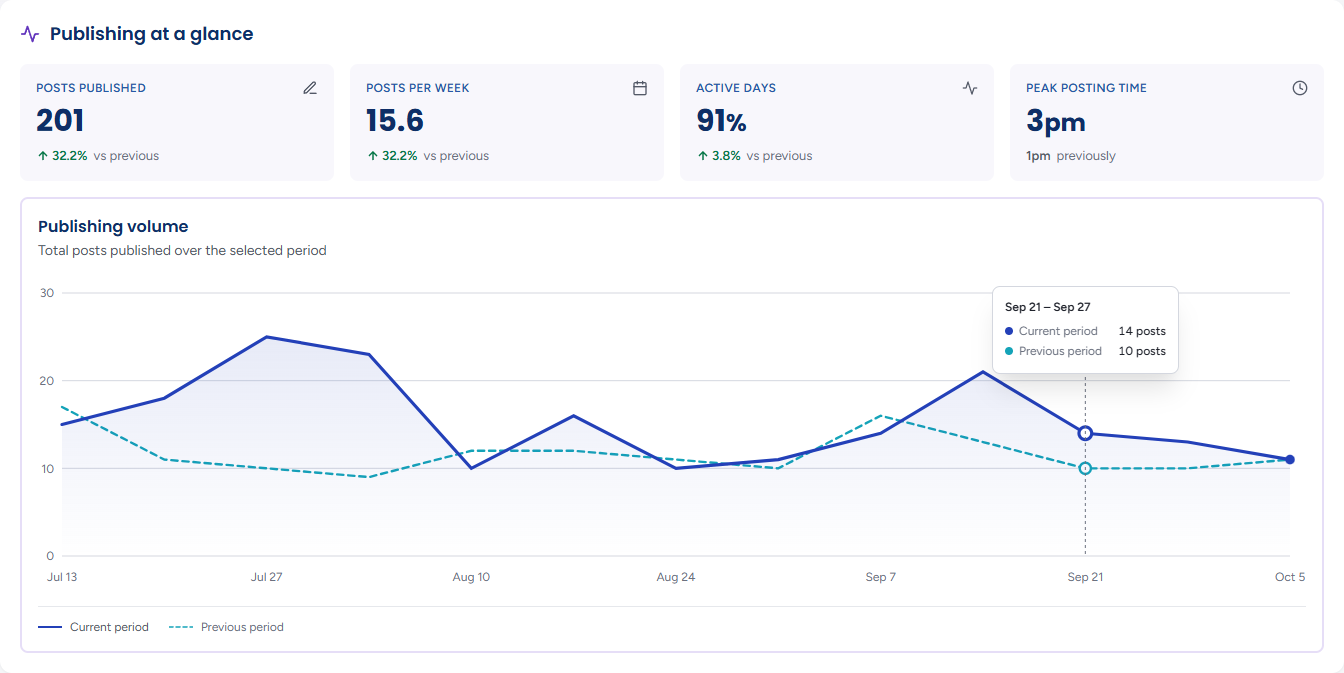
- Posts published — the total for the period
- Posts per week — the same total averaged over the weeks in the period
- Active days — the share of days on which at least one post went out
- Peak posting time — the hour of the day you post most, in your organisation's timezone, with the previous period's peak beneath it ("1pm previously"). A period with no posts shows a dash, and the "previously" line is left out when the previous period had none
The first three carry an up or down badge against the previous period.
Publishing Volume
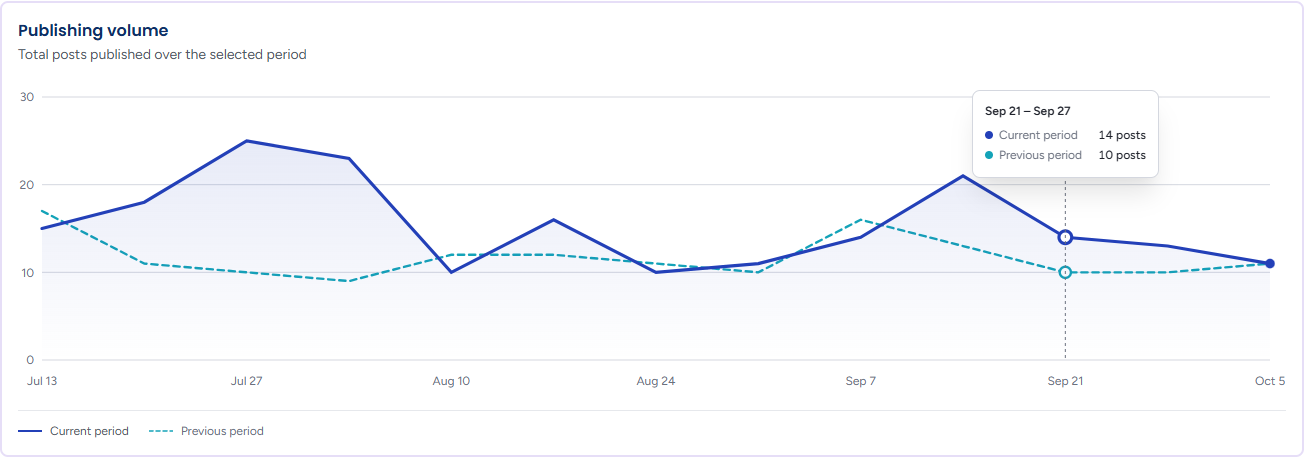
Total posts published over the selected period, week by week. The solid line is the Current period and the dashed line the Previous period, laid over the same weeks so a change in rhythm stands out. Hover a point for the week and both counts.
Publishing Behaviour
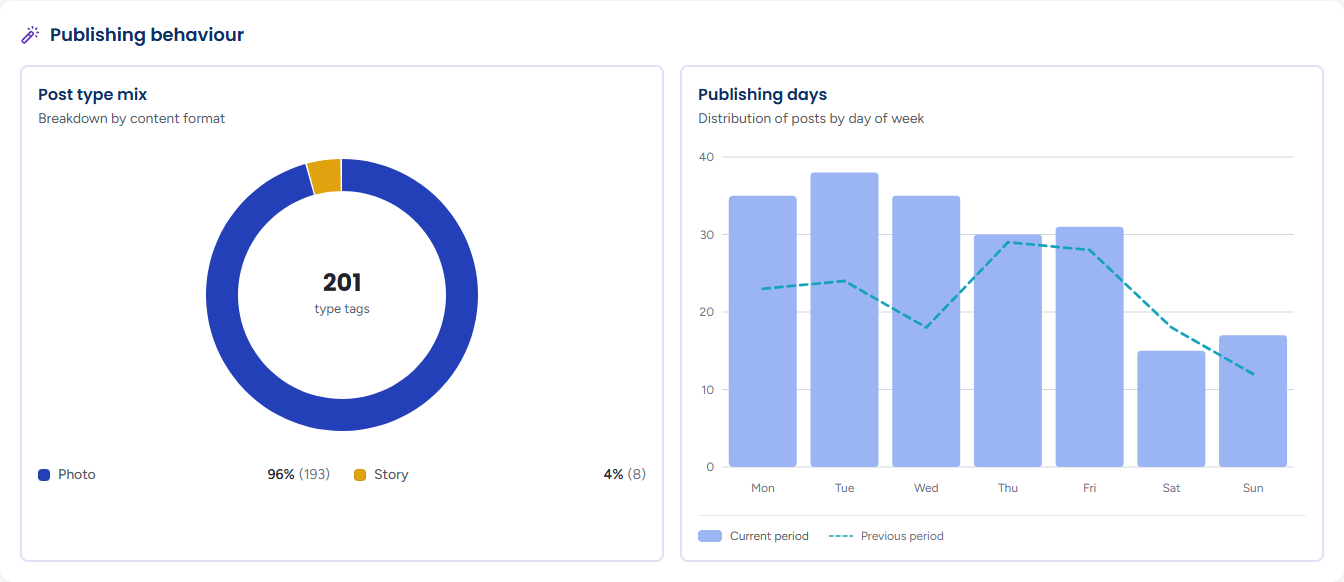
- Post type mix — Breakdown by content format: a donut of your posts by format (Photo, Video, Story, Text and Other), with the number of type tags in the centre and the share and count of each format beside it, for example Photo 96% (193). Empty, it reads No posts were published in the selected range.
- Publishing days — Distribution of posts by day of week: posts on each day from Monday to Sunday, with the previous period alongside for comparison. Hover a day for both counts
Most Recent Posts
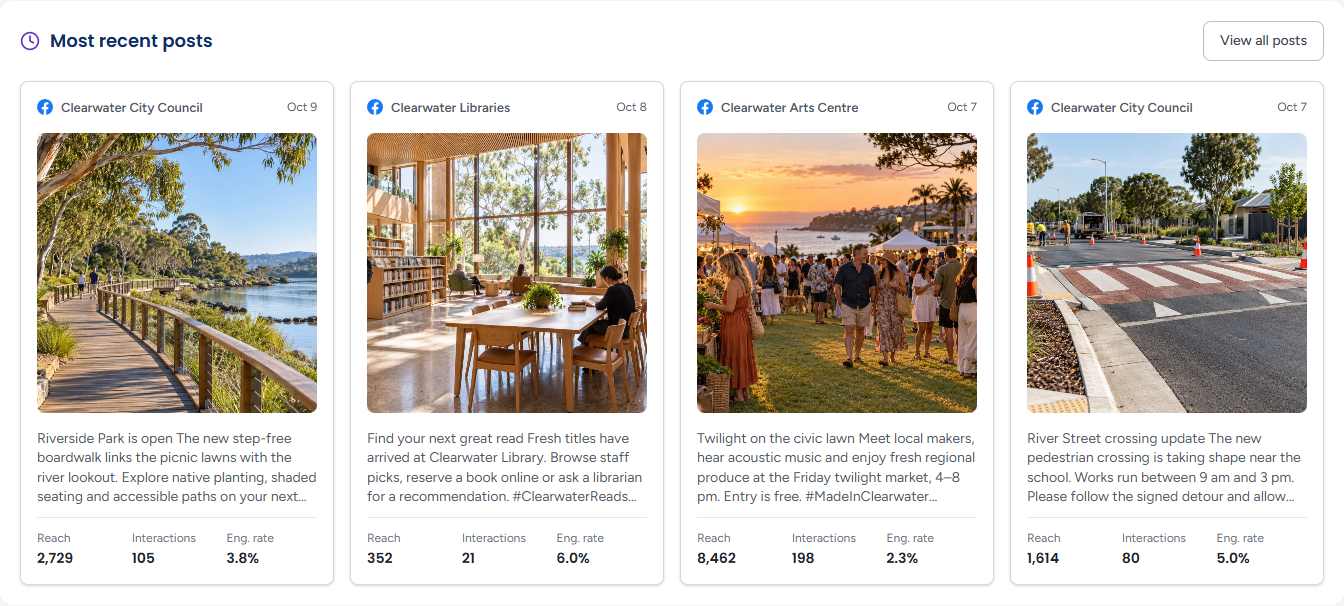
The four latest posts in scope, each with its account, date, picture, text and its Reach, Interactions and Eng. rate. Click a card to open it in the Post Inspector; View all posts opens the Posts Explorer on the same period and accounts. A period with nothing published reads No posts were published in this period.
Platform Comparison
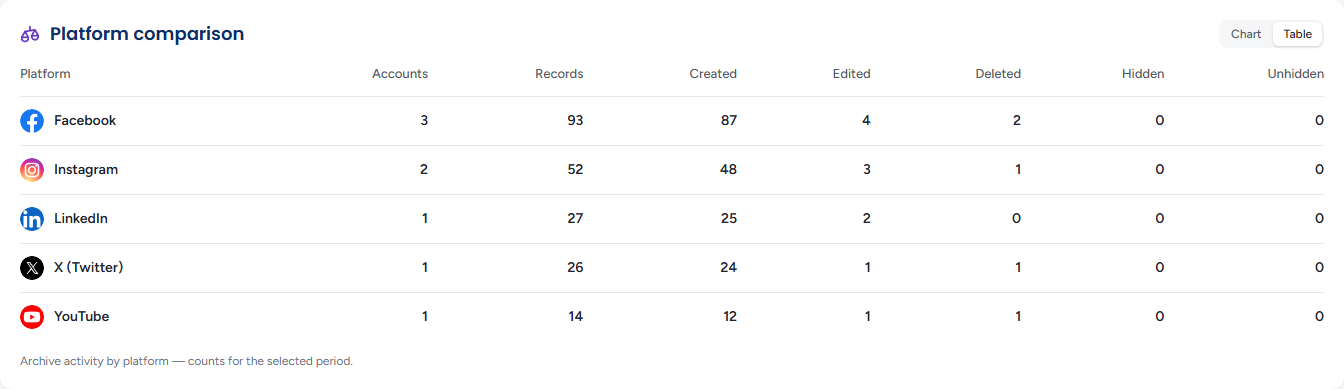
Archive activity for the period, one row per platform: the number of connected Accounts and the Records captured, split into Created, Edited, Deleted, Hidden and Unhidden. These are counts of what Brolly archived, so they include comments and other people's contributions as well as your own posts. The caption beneath says so: Archive activity by platform — counts for the selected period.
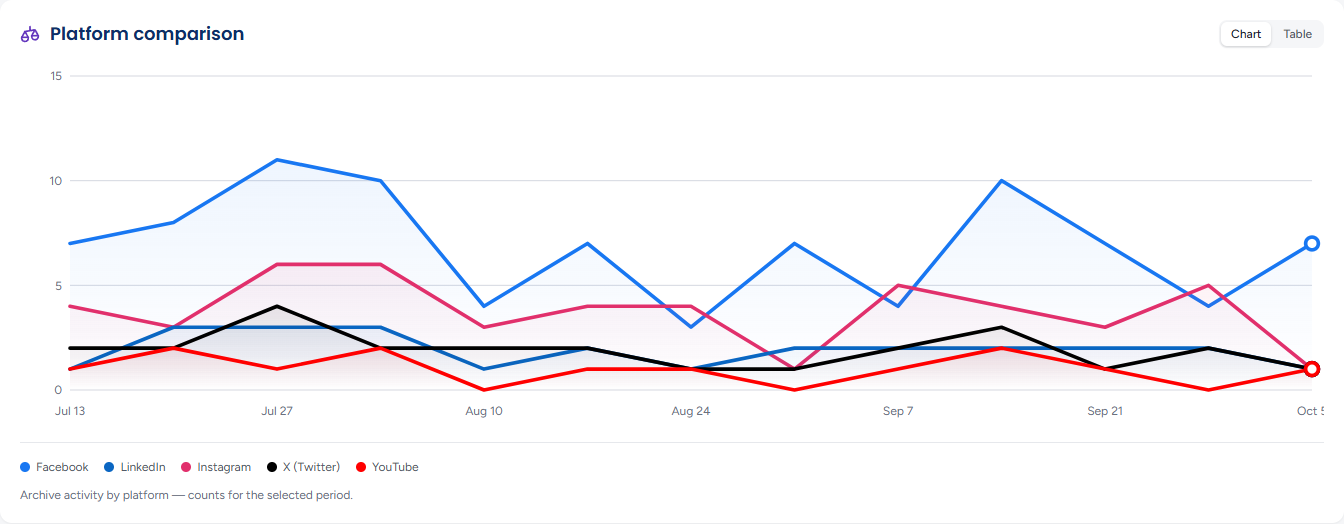
The Chart / Table toggle at the top right switches between the table and a chart of each platform's records on one set of axes; the choice is written into the page's address. A quiet period reads No archive activity on any platform in this period.
Publishing Actions
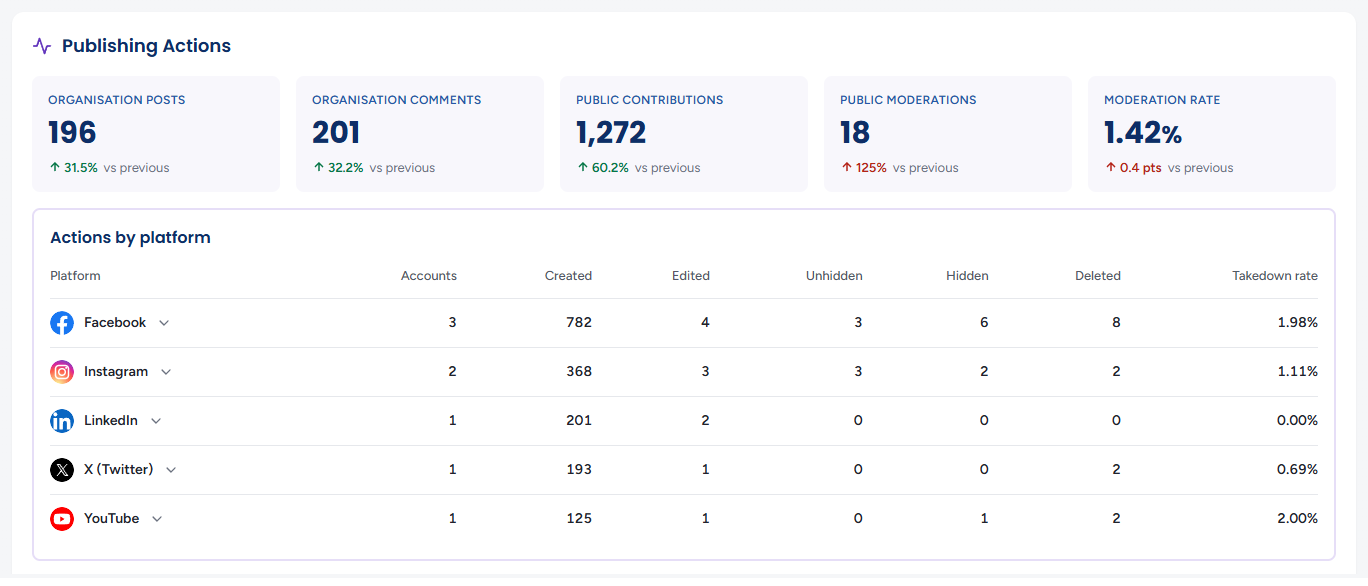
Exact counts across the whole archive for the period, each with an up or down badge against the previous period:
- Organisation posts and Organisation comments — what your own accounts wrote
- Public contributions — comments and other contributions written by the public
- Public moderations — hides and deletes on public comments
- Moderation rate — public moderations per 100 public comments written, with the change shown in points
Actions by platform
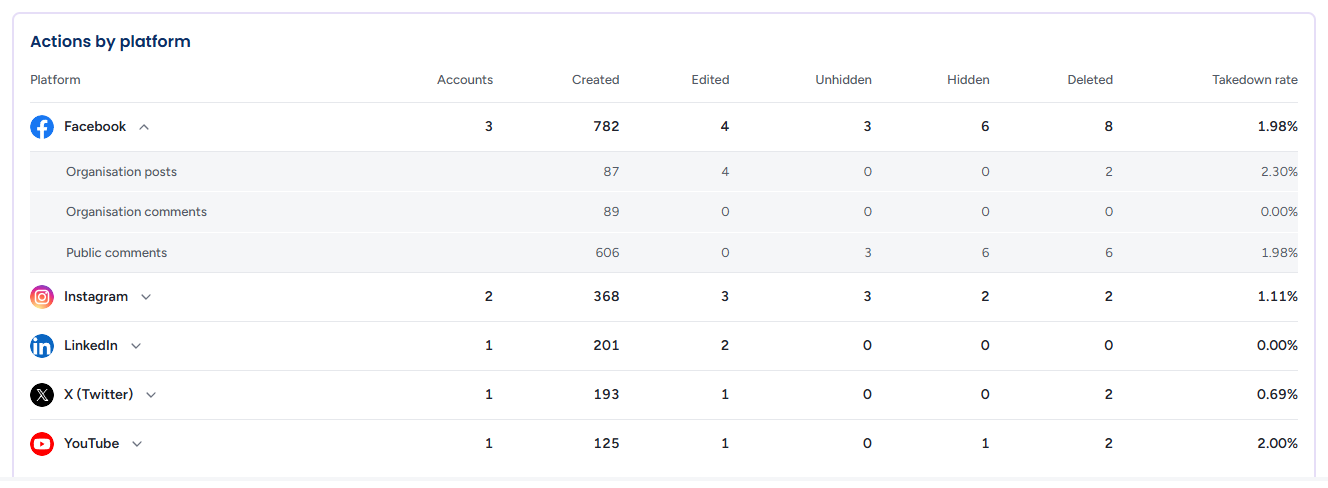
One row per platform with its Accounts, then the actions counted in the period — Created, Edited, Unhidden, Hidden and Deleted — and a Takedown rate. Click a platform's name (the chevron beside it turns) to open its row into three parts: Organisation posts, Organisation comments and Public comments, each with its own counts and rate. Click it again, or another platform, to close it; one platform is open at a time. A quiet period reads No archive actions on any platform in this period.
Read the figures with the note beneath the table in mind:
- Created counts each post or comment written once; the other columns count actions, so a comment hidden twice counts twice, and actions on things written before the period are included
- A deleted comment may have been removed by whoever wrote it — the archive does not record who — so read that figure as an upper bound
- Each breakdown row's rate is its hides and deletes per 100 written; on the organisation's own rows that includes what it took down itself. A platform's rate is its public comments' rate
Tips
A falling Active days figure with steady Posts published means posting is bunching up — several posts on some days and none on others.
Use the Platform comparison table when someone asks "how much have we archived from X this quarter?" — it is the same count the Archive filters would give you.
Moderation rate is the figure to quote when you are asked how often comments are taken down. Because deletes may be the commenter's own, open the platform's row and pair it with Hidden on the Public comments line for the part your team controls.