Posts Explorer
Every post in the period as a sortable table, and the Post Inspector that opens from it with a single post's performance, conversation, sentiment and audience.
Overview
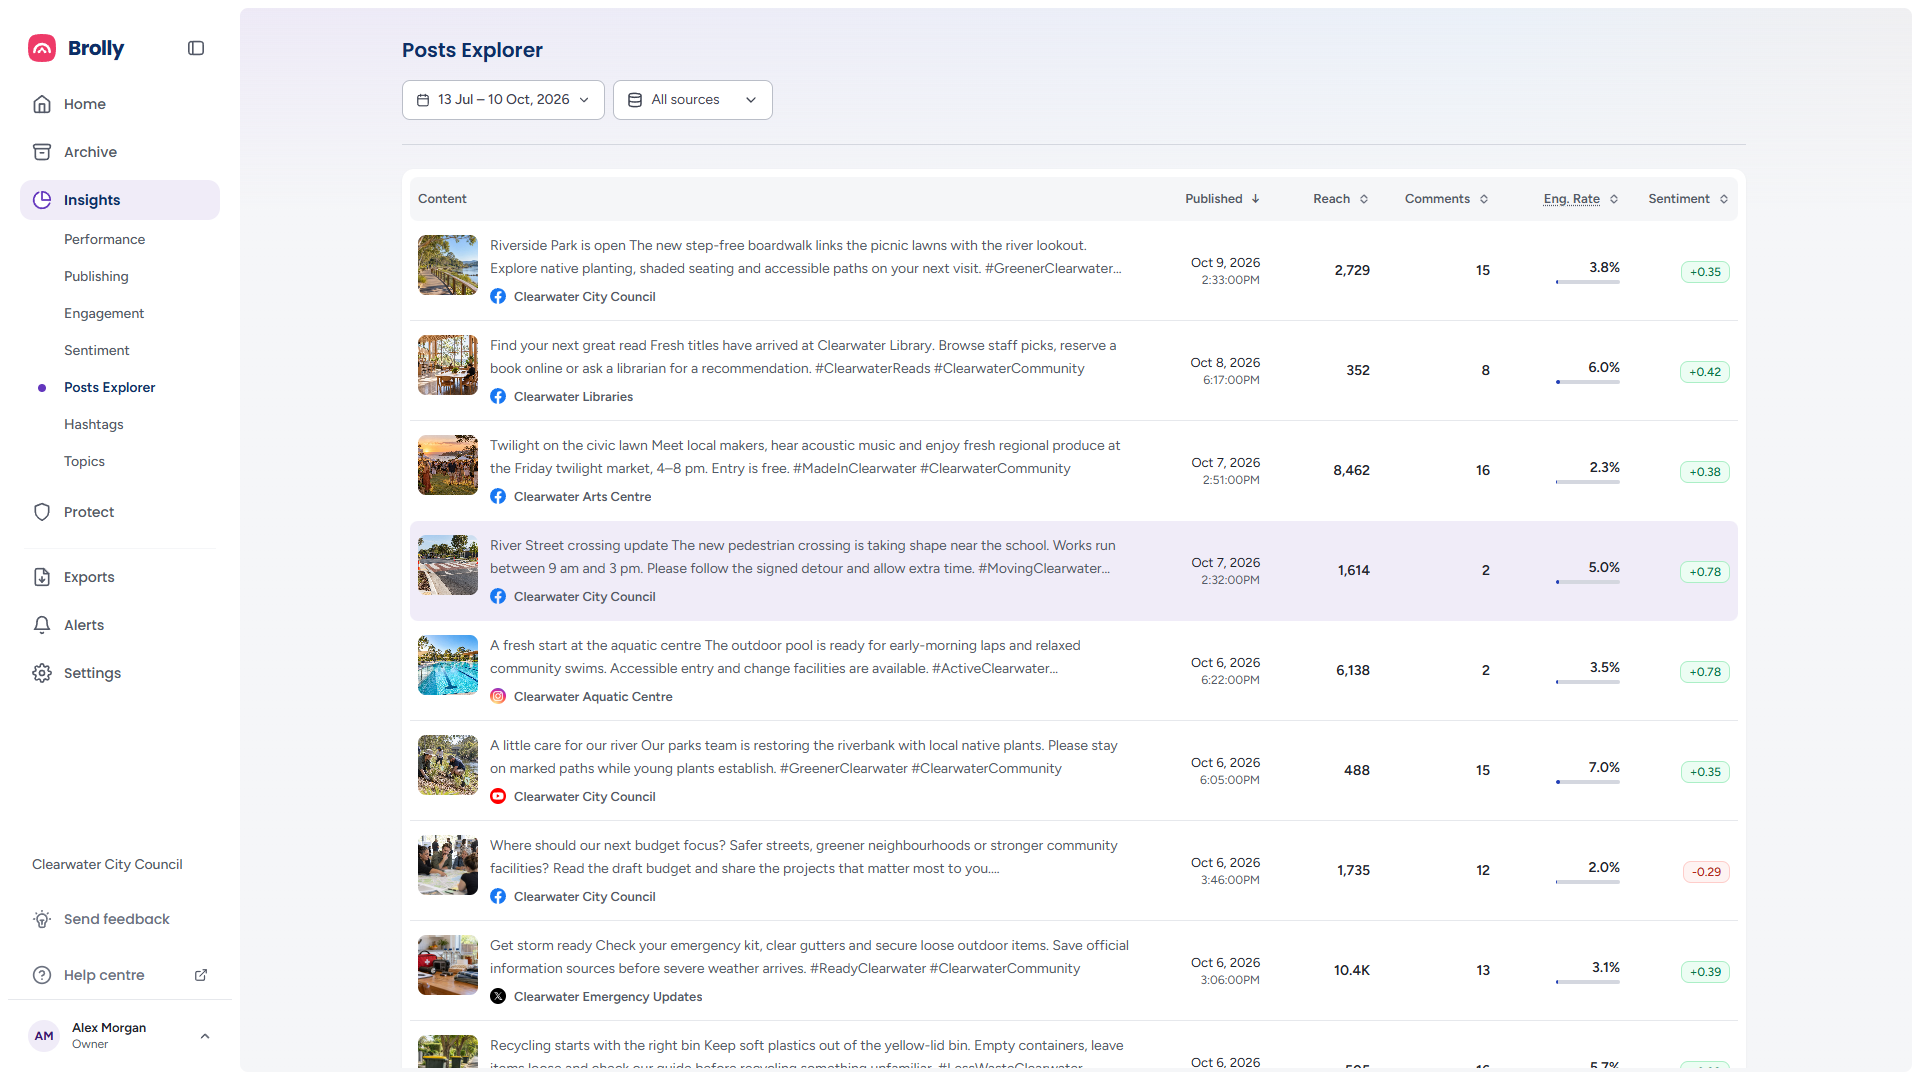
The Posts Explorer is the table behind the charts: one row per post, with the figures the other Insights pages summarise. Sort it to find the post you are after, then click the row to open the Post Inspector, which the post cards on Publishing, Engagement and Sentiment also open.
How to Get There
- Click Insights in the left sidebar, then Posts Explorer
- Or click View all posts beneath Most recent posts on the Publishing page — it opens the Explorer on the period and accounts you were already looking at
Set the period and accounts with the date range and sources controls at the top. They are described in The Toolbar. The Posts Explorer is the one Insights page without an Export button; the printable report does not include its table.
The Table

- Content — the post's thumbnail, the start of its text, and the account that published it with its platform icon. The thumbnail tells a video from a photo, and shows a neutral placeholder until a post's format is known
- Published — date and time, in your organisation's timezone
- Reach — how many people saw it. A rocket icon beside the figure marks a post whose reach includes paid reach; hover it for the paid figure
- Comments — how many it drew, counted from the comments in your Archive
- Eng. Rate — hover the dotted heading for the definition, Interactions ÷ Reach. A small bar under each figure lets you compare down the column; a post with no reach shows a dash
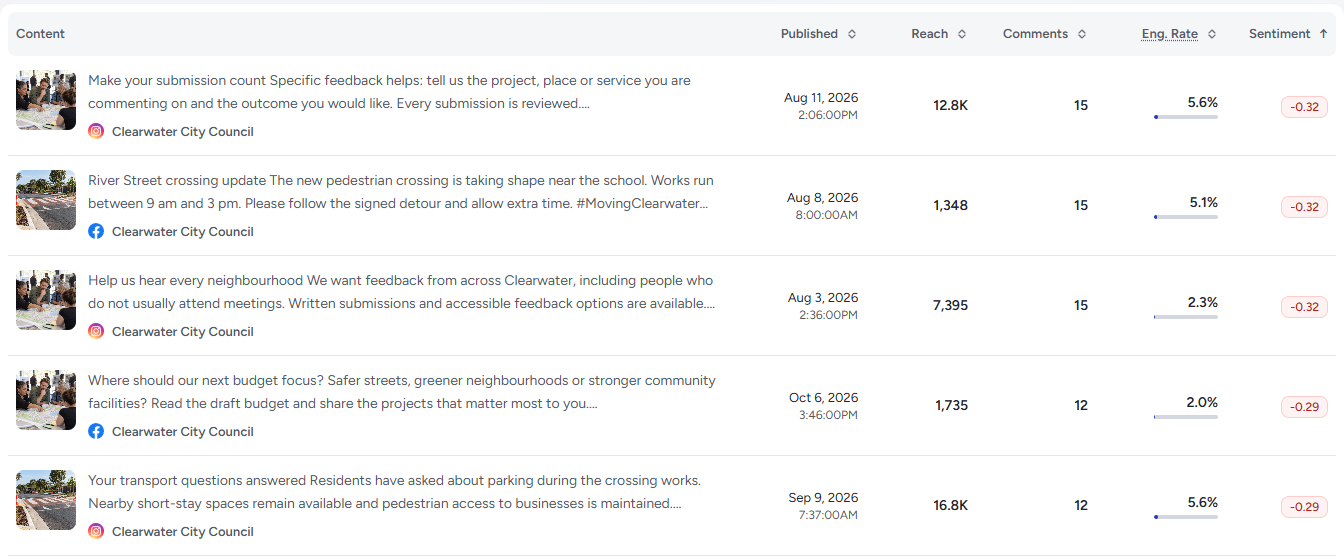
- Sentiment — the post's score from −1 to +1 as a badge: green when positive, red when negative, grey when close to neutral
Click a column heading to sort by it, and click again to reverse the order. The arrow beside the heading shows the current sort, which is Published newest first until you change it; sorting returns you to the first page. Posts without a value for the chosen column sort last. The table can be driven from a keyboard.

The table shows fifteen posts at a time. The bar at the bottom says which of the total you are looking at — Showing 1–15 of 201 posts — and you move through the rest with the strip of page numbers (the first few, an ellipsis, and the last few) or the Previous page and Next page arrows, which grey out at either end. The bar is left out when everything fits on one page. On a window narrower than about 900px the table becomes one card per post, with a Sort posts by menu and an ascending/descending button in place of the column headings.
A note above the table may say Covers 10,000 of the 12,400 posts in this period, the most Insights can read at once when the period holds more posts than the Explorer can load (the limit is 10,000; other lists in Insights have their own, lower limits). Figures derived from the table then cover the loaded posts only, so narrow the period or the accounts if you need them exact. A period with no posts reads No posts in the selected period. Try widening the date range or clearing scope filters — or, before any account is connected, says so and offers a Connect an account link.
The Post Inspector
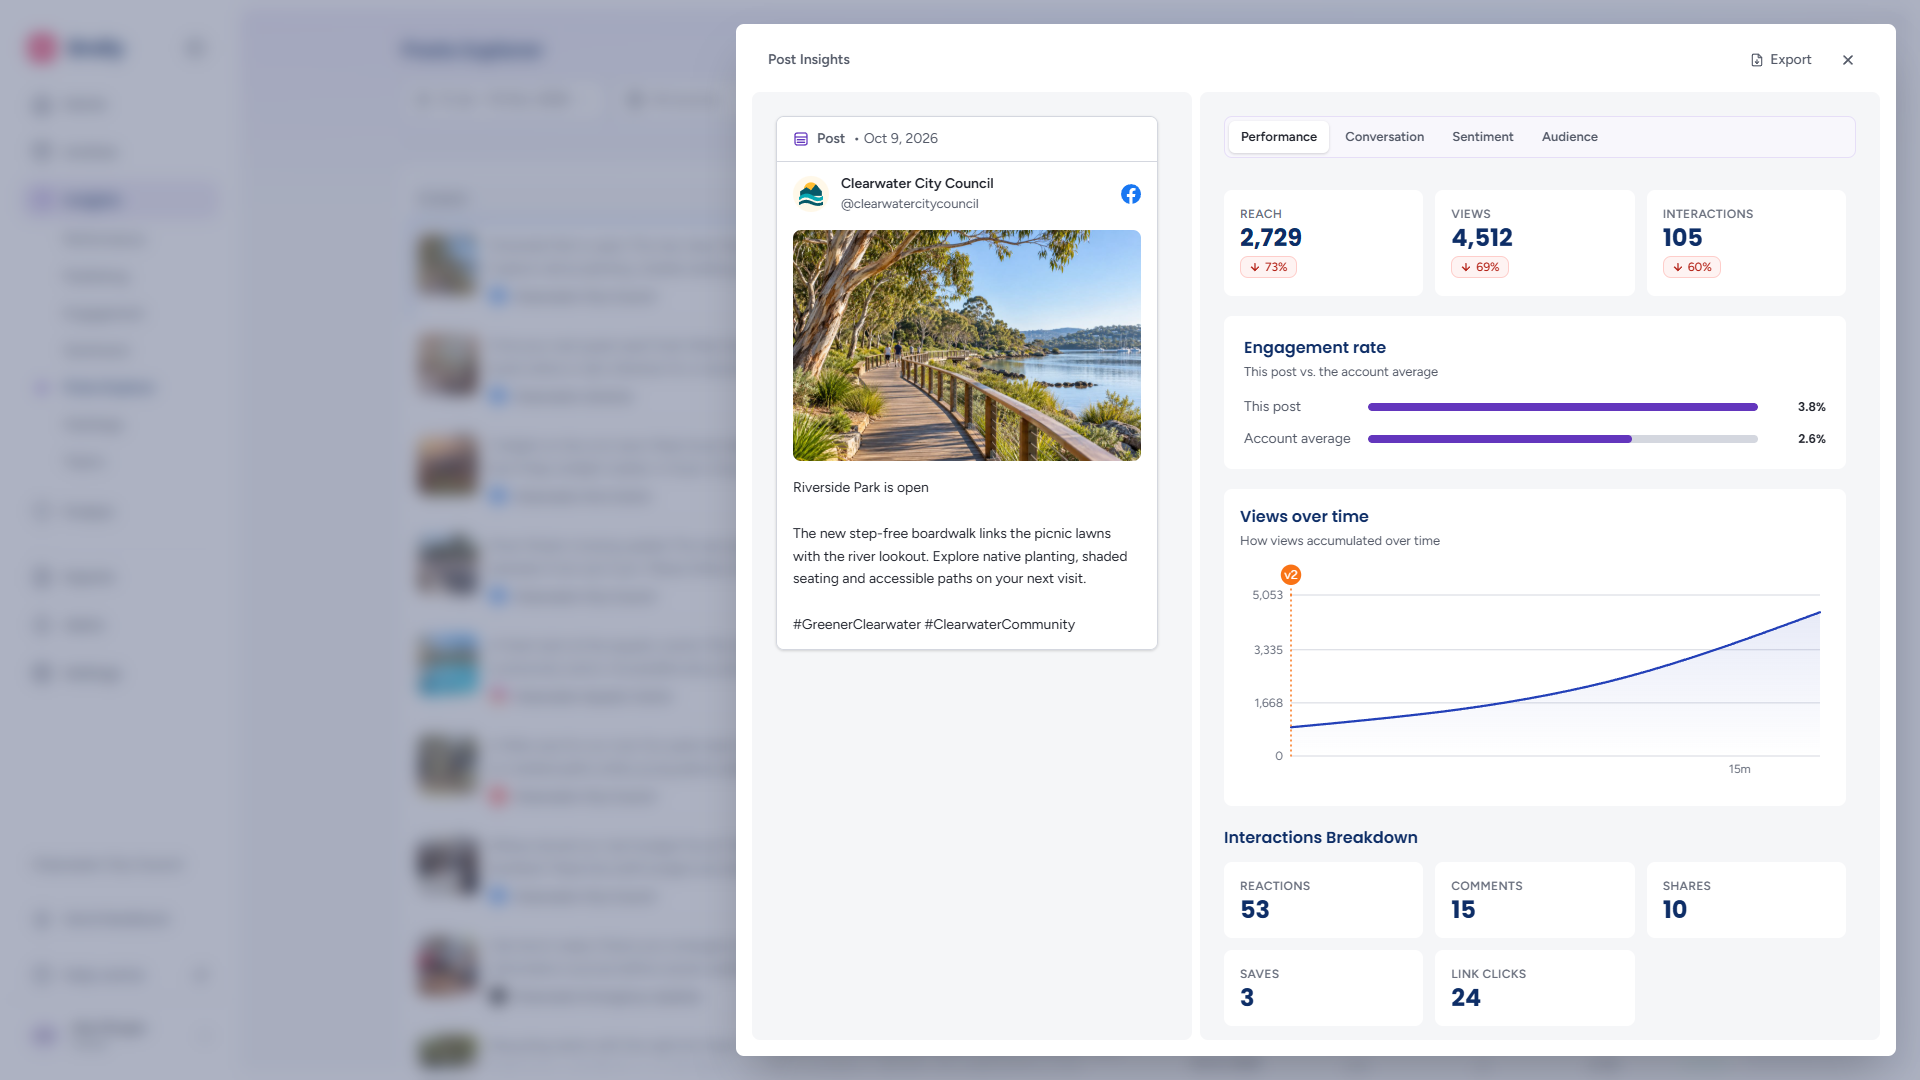
Clicking a row opens Post Insights over the page, sliding in from the right. The post itself is on the left — account, platform, media and text — and its figures on the right, under four tabs. View live in the header opens the post on its platform in a new tab, where Brolly holds a link to it. Close the inspector with the × at the top right, the Esc key, or a click on the dimmed page behind it. Opened from the Posts Explorer, the inspector adds the post to the page's address, so a copied link opens straight to that post; if that post is no longer among the posts loaded, the page says That post isn't among the posts loaded here, so its Inspector could not be opened. On a phone it fills the screen, with the post as a Post tab of its own.

Performance
Reach, Views and Interactions for the post, each with a badge showing how it compares with the account's average. Its Engagement rate is drawn as a bar against the Account average — that account's real figure across all of its posts, not just the period you picked — so you can see at once whether the post did better or worse than usual; the average reads "—" for an account with no measured reach, and the block says Engagement rate needs reach data, which isn't available for this post or its account when neither can be measured. Views over time — How views accumulated over time — charts the history where the platform supplies one, in your organisation's days rather than UTC, with orange v2, v3 markers at each later version; otherwise it says Not enough metric history to chart views over time for this post. The Interactions Breakdown splits the total into Reactions, Comments, Shares, Saves and Link clicks, and a Reaction Breakdown (Like, Love, Haha, Wow, Sad, Angry) follows where the platform reports it. The comment count comes from the comments in your Archive, not the platform's own tally, which can arrive weeks later.
Conversation
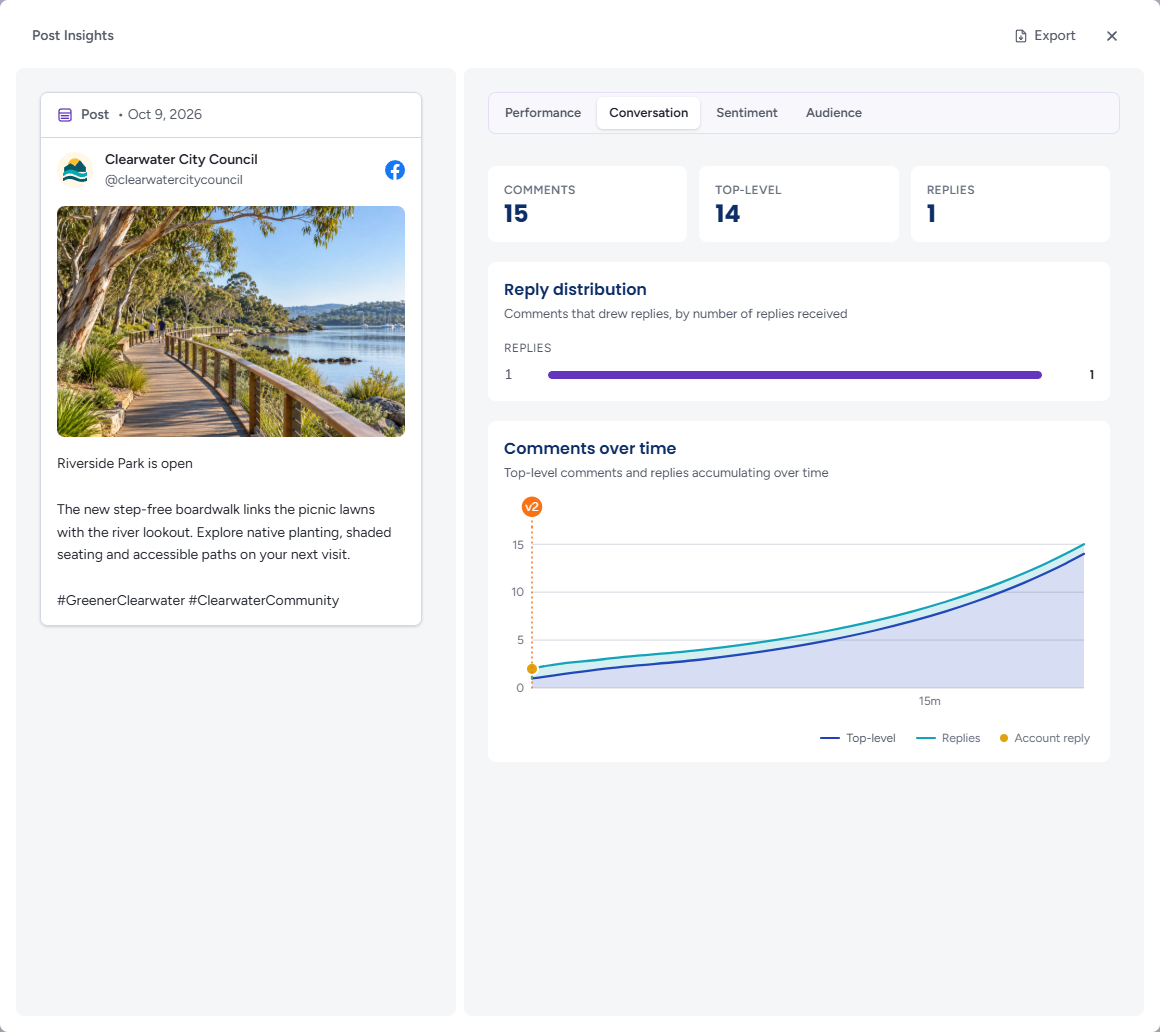
The number of Comments, split into Top-level comments and Replies where the platform records the difference. Beneath, Reply distribution — Comments that drew replies, by number of replies received — groups the comments that were replied to by how many replies they got (1, 2, 3, 4, 5+), and Comments over time charts top-level comments and replies accumulating since the post went up, with the same version markers as the views chart. Where the platform does not record the split the tab says The top-level vs reply split isn't available for this post; a thread of more than 10,000 comments is split on the first 10,000.
Sentiment
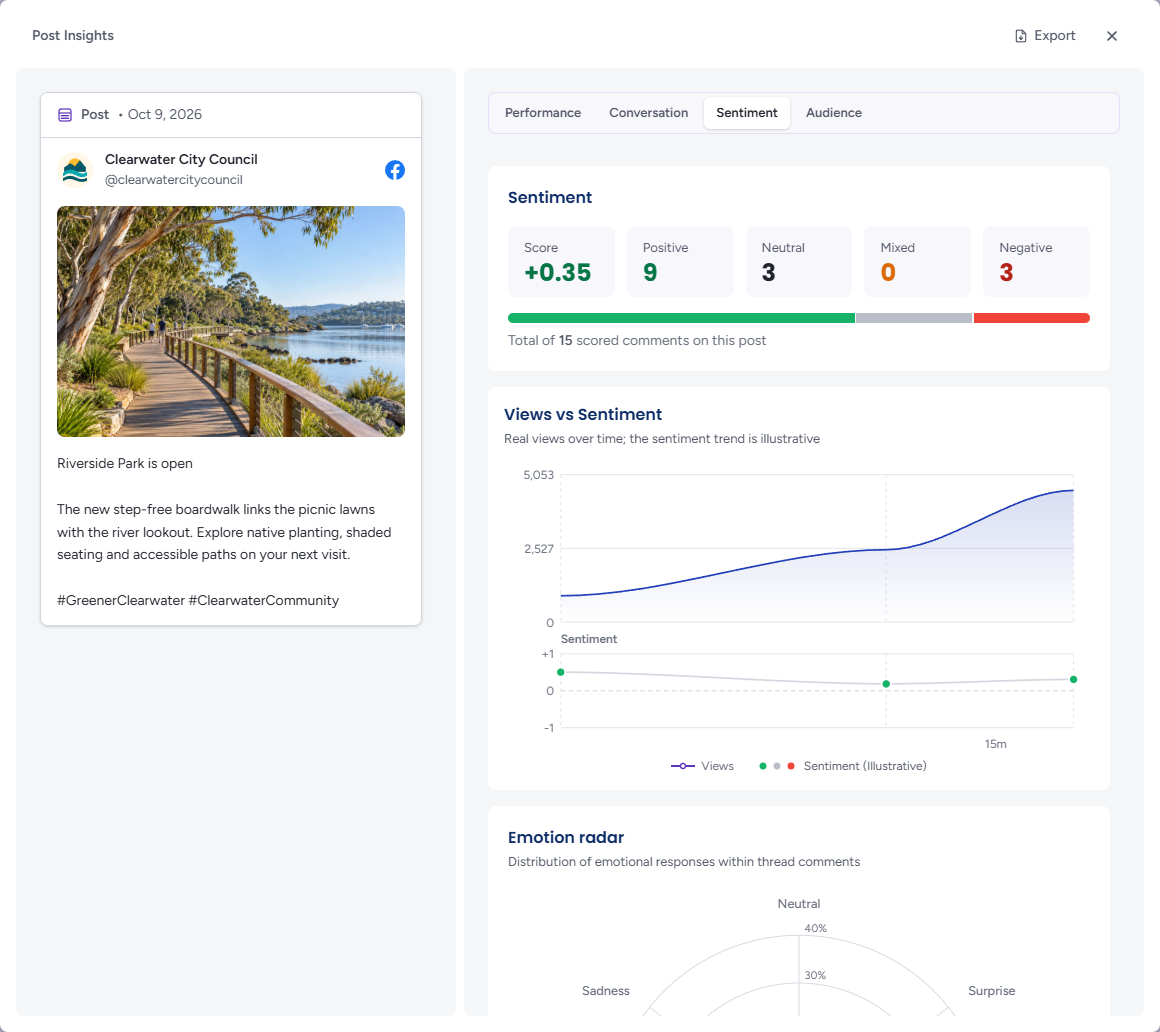
The post's sentiment Score and the split of its comments into Positive, Neutral, Mixed and Negative over a stacked bar. With nothing scored it reads No comments on this post carry a sentiment score, so there is no split to show. With the emotion analysis add-on an Emotion radar — Distribution of emotional responses within thread comments — follows; it reads Analysing comment emotions… while the thread loads and is withheld, with Not enough comment emotion data to chart for this post, until at least five comments have been emotion-scored, so a handful of comments does not read as a distribution.
Audience
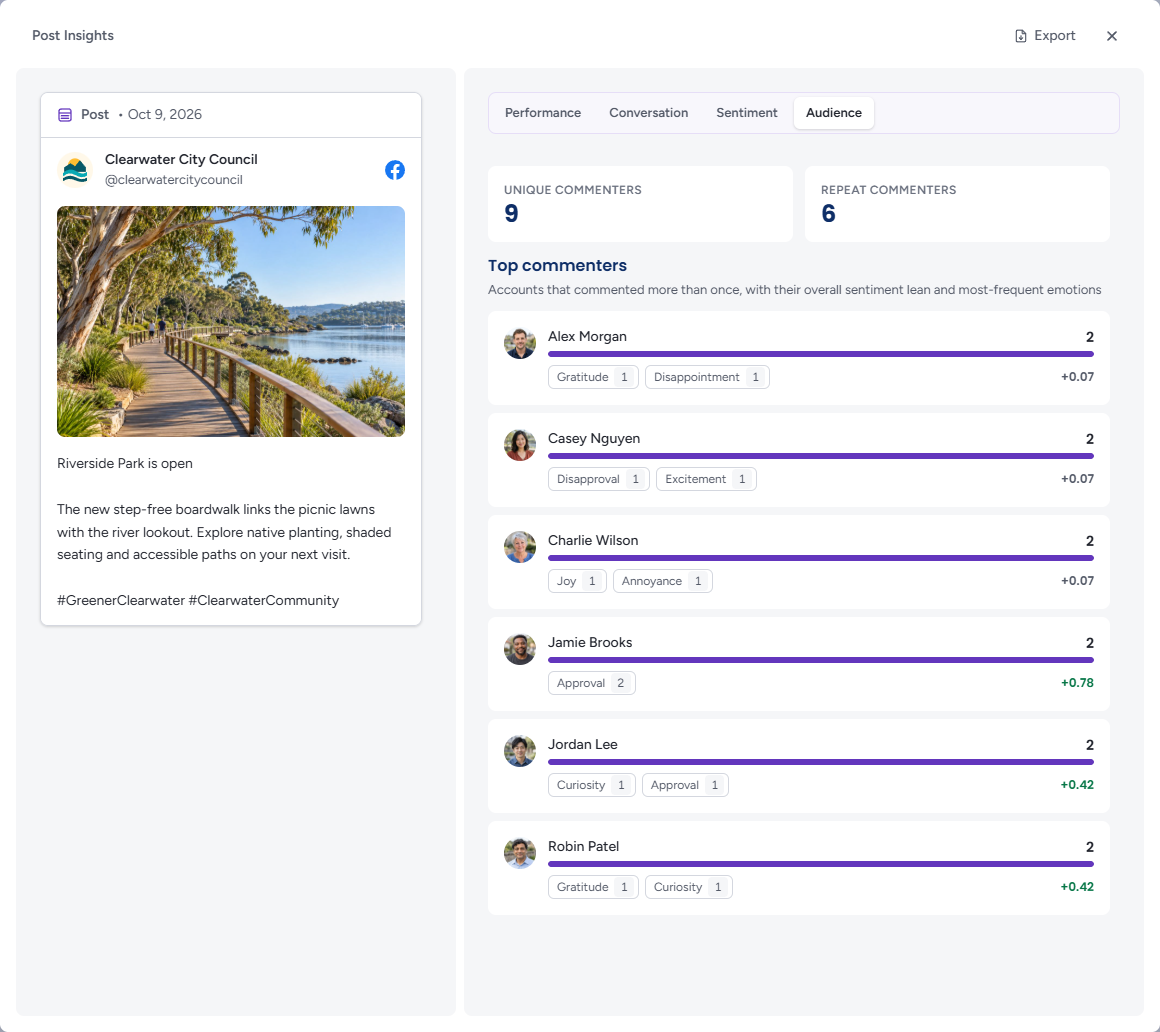
Unique commenters and Repeat commenters for the post, then Top commenters — Accounts that commented more than once, with their overall sentiment lean and most-frequent emotions: each with a bar for how many comments they left, up to three emotion chips with counts, and their average sentiment score. Where the platform does not share commenter details the tab says Commenter data isn't available for this post; a post nobody has commented on yet reads No comments to analyse for this post yet, and one where nobody commented twice says so.
If the thread cannot be fetched, the Conversation, Sentiment and Audience tabs say Couldn't load this post's comments. Try reopening the inspector.
Exporting a Post
The Insights inspector does not export a post. To export a post's full archived record — every captured version, its comments and media — open it from the Archive instead. See Viewing a Record.
Tips
Sort by Sentiment ascending to bring the most negatively received posts to the top, or by Comments descending to find the conversations worth reading.
The inspector shows the analytics for a post. For what the post said and how it changed over time, the Archive's record inspector holds every captured version — the two are complementary.